Solar Basics: How Home Solar Works
A practical, no-jargon walkthrough of the parts, the math, and the policies that determine your savings.
Contents
1) Core components
You can be grid-tied, hybrid (grid + batteries), or off-grid.
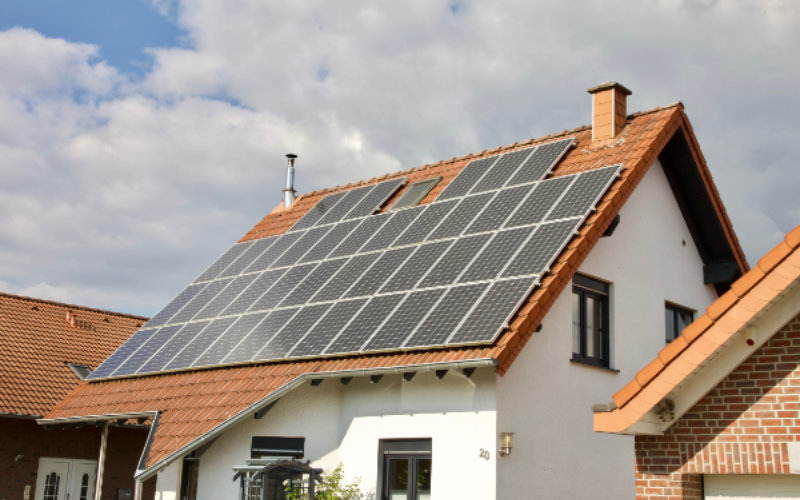
Panels
Silicon PV modules convert sunlight to direct current (DC). Output depends on sun intensity, temperature, orientation, and shading.
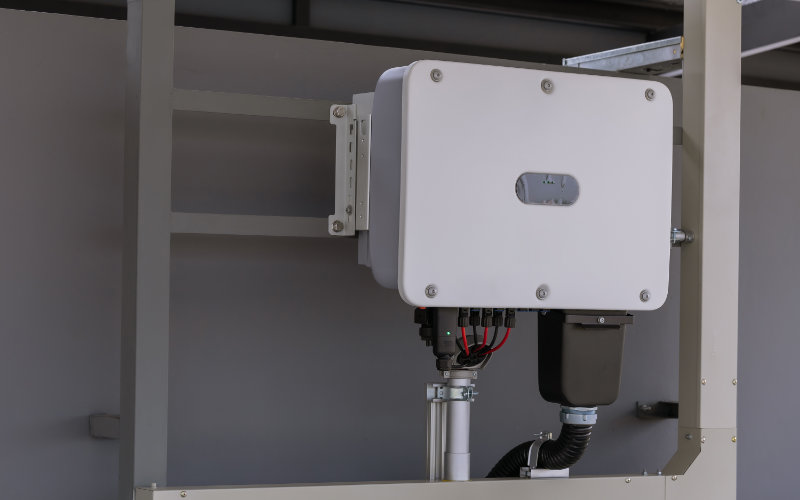
Inverter
Converts DC from panels to grid-synchronous AC. Microinverters or optimizers can help where roofs have multiple orientations/shading.
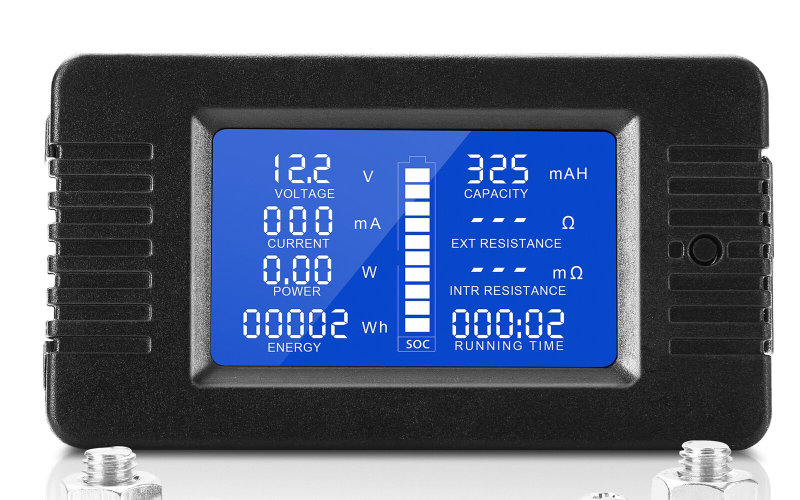
Metering
In grid-tied systems, a bidirectional meter tracks imports (from grid) and exports (to grid). Policy determines credits for exports.
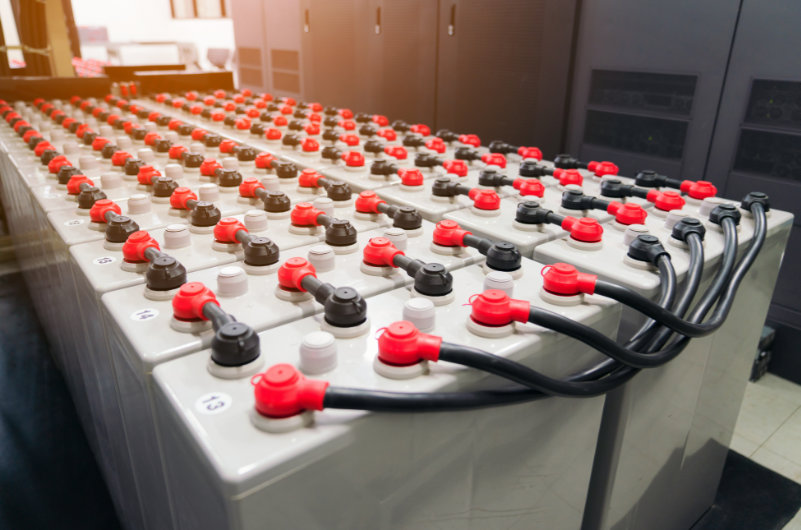
Batteries (optional)
Store excess solar for night and outages. Useful where export credits are low or for resilience.
2) How production is calculated
Roof factors
- Tilt & azimuth: Ideally near your latitude; south-facing in N. hemisphere.
- Shading: Trees, chimneys, or other obstructions can reduce output significantly.
- Temperature: Hot modules lose efficiency; good airflow helps.
3) Net metering & export credit
When your system produces more than your home uses, excess flows to the grid. Utilities may credit exports at:
- Retail (100%) — classic net metering.
- Partial (e.g., 25–90%) — net billing or avoided cost rates.
- Time-of-use (TOU) — credits vary by hour/season.
Try the Compare: Solar vs Grid page and set “Net metering credit” to your policy.
4) Right-sizing a system
Common targets: cover ~60–100% of annual usage (depending on roof space and export policy). Key inputs:
- Usage: kWh/day or kWh/year from your bills.
- PSH & PR: local sun hours and performance losses.
- Budget & roof area: practical constraints.
Quick estimation
Example: 9,000 kWh/yr, PSH 5.5, PR 0.75 ⇒ 9000 ÷ (5.5×365×0.75) ≈ 6.0 kW
5) Costs, incentives & payback
Installed cost is often quoted as $ per watt (e.g., $2.50–$3.50/W). Incentives reduce net upfront. O&M is small but non-zero.
- Gross cost: size (kW) × 1000 × $/W
- Net upfront: gross − incentives
- O&M: ~0.5–1.5% of initial cost / year
What really drives savings?
- Local grid price and expected escalation
- Self-consumption vs export credit
- System performance (PSH, PR, degradation)
- Financing terms (APR, term)
6) Where batteries fit
Batteries increase resilience (backup) and can boost economics where exports are credited poorly or peak rates are high.
- Backup: Keep essentials on during outages.
- Time-shift: Store daytime solar for evening peaks.
- Demand management: Clip short spikes (motors starting).
7) Maintenance & lifespan
- Panels: 25–30 year life; occasional cleaning; monitor for shading growth.
- Inverters: 10–15 years typical for string; micros often carry 20–25 year warranties.
- Batteries: 10–15 year warranty windows common; cycle life depends on depth-of-discharge and temperature.
8) Next steps & calculators
Make it your numbers, not averages:
- Compare: Solar vs Grid — monthly bill and savings
- Solar ROI / Payback — LCOE, NPV, IRR
- Inverter Sizing — continuous & surge
- Battery Sizing — hours of backup
- Appliance Cost (Grid) — find energy hogs